

Massachusetts Institute of Technology, a private research university in Cambridge, Massachusetts, ranks No. 2 among national universities and No. 1 for undergraduate engineering, according to U.S. News & World Report 2026 Best Colleges rankings. For the Class of 2030, MIT admitted 1,299 of 28,349 applicants for an overall acceptance rate of 4.58% — a slight uptick from 4.52% the previous year, according to The Tech.
MIT Acceptance Rate: Class 0f 2030
Beneath that headline number sits a more useful story. MIT’s Early Action rate was 5.51%, and the Regular Action round added another 644 offers. Across recent cycles, the striking feature is not movement but constancy: the overall rate has held remarkably steady even as the applicant pool has grown and shrunk by thousands. Our table below lays out five years of results.
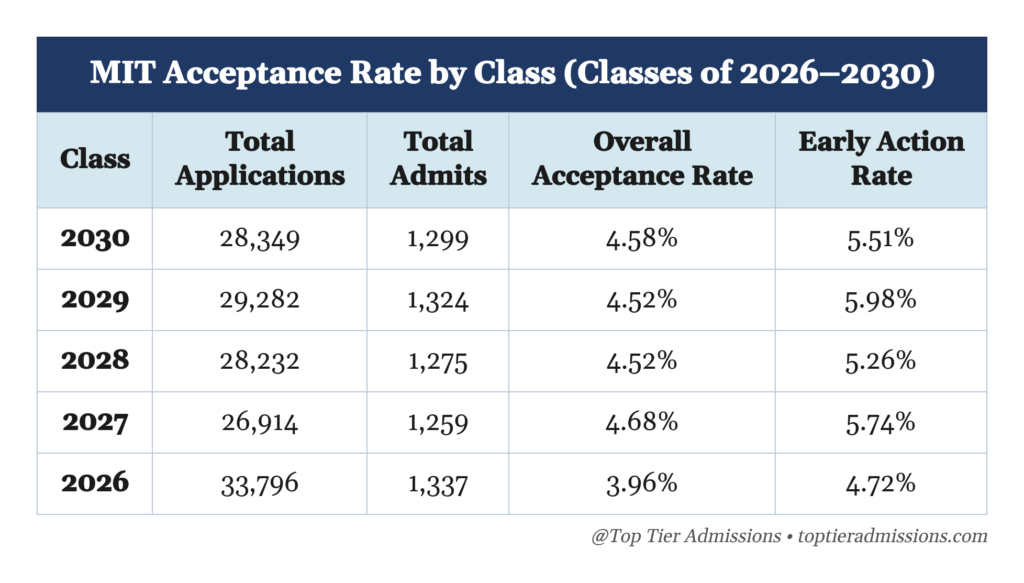
MIT Acceptance Rate Trends: Five Years of Data
Two things stand out. First, the admit count barely moves. MIT has offered between 1,259 and 1,337 seats every year. Second, with that count essentially fixed, the acceptance rate tracks application volume: the Class of 2026’s pandemic-era surge to 33,796 applications,the only year above 30,000,produced the lone sub-4% rate. Once MIT reinstated its SAT/ACT requirement, among the first selective universities to do so, volume settled into the high-20,000s and the rate into the mid-4% range, where it has held for four straight cycles.
MIT’s Free Tuition Policy: Impact on Applications
One policy change is worth watching as a potential driver of future volume. Beginning with the 2025–26 academic year, MIT guarantees free tuition for admitted students from families earning up to $200,000. Dean of Admissions Stu Schmill credited the policy, in The Tech, with a slight uptick in applications the prior cycle — but it hasn’t sparked a sustained surge, and applications slipped for the Class of 2030. Whether this new policy eventually broadens the applicant pool,, and nudges the rate down, remains to be seen.
MIT: How the Class is Built
To fill a class of about 1,100, MIT extended roughly 1,300 offers for the Class of 2030, split almost evenly between the early round and Regular Action,roughly 650 in each. That regular round is where deferred early applicants are reconsidered “without prejudice” alongside new applicants, and MIT says 150 to 250 of those offers typically go to deferred students — proof that a deferral is a genuine second read, not a soft rejection.
MIT Admissions Requirements
Because MIT requires scores from every applicant, admitted students cluster near the ceiling (a middle 50% of 1520–1570 on the SAT — identical across MIT’s last three Common Data Sets — and 34–36 on the ACT). At that height, strong scores are the price of entry, not an edge: they get an application read but rarely set one applicant apart from another. MIT’s published rubric reflects this. It rates the academic core: rigor of coursework, GPA, scores, essays, and recommendations — as merely “important,” on par with interviews, activities, and talent, and reserves its top “very important” rating for a single factor: character and personal qualities. It gives no weight at all to legacy status. What drives the decision, the admissions office says, is less any single credential than “the match between applicant and the Institute” — alignment with a mission of hands-on problem-solving, collaboration, and thoughtful risk-taking.
Those qualities reveal themselves through the application itself — and MIT’s is unlike any other. MIT accepts neither the Common nor the Coalition Application; students apply through MIT’s own portal, which caps the activities list at four and replaces the long personal statement with a series of short, pointed essays — a format that rewards depth and authenticity over a crowded résumé. Our guide, Navigating the MIT Application, breaks down how its questions differ from the Common App.
Should You Apply to MIT Early Action or Regular Decision?
TTA Top Tip: At schools with binding Early Decision, applying early is a genuine strategic lever. MIT is different. Its Early Action round is non-binding and non-restrictive, MIT does not consider demonstrated interest, and the admissions office states plainly that there is “no advantage to applying” early. The higher early rate simply reflects a stronger, self-selected pool, not a thumb on the scale. What moves the needle is how well your application uses MIT’s format: depth over breadth, and short essays that show how you think. Apply Early Action only if your application is truly ready by November 1. If it isn’t, the January deadline is the better choice.
At Top Tier Admissions, we are committed to making the college admissions process more transparent. Easy access to clear data helps families understand trends in college admissions to make more informed decisions. This year we’re once again collecting acceptance rate data at selective schools and providing insight and analysis of our own.
Explore Additional Resources
Are you thinking about applying to MIT? Curious about admissions trends and strategies to improve your odds? Contact us to discuss our Application Boot Camp® or Private Counseling program — we look forward to supporting you!
- MIT Admissions: Acceptance Rates & Statistics
- MIT Acceptance Rate: Early Trends
- Cracking the Code: Navigating MIT’s Admissions Process
- Navigating the MIT Application
- 2026 College Acceptance Rates: What’s Behind the Record Lows and What Families Should Know
Stay Connected For More Expert Guidance
Want to stay in the loop? Follow us on Instagram @toptieradmissions and subscribe to our blog for expert advice and admissions insights.
Know someone else navigating the college process? Pass it along — they’ll thank you later!
- Inside Personal Application Boot Camp®: A Q&A with Senior Private Counselor Rohail Premjee - July 27, 2026
- What Vanderbilt’s New NYC Campus Actually Means If You’re Applying - July 22, 2026
- Princeton Acceptance Rate: Class of 2030 - June 26, 2026
