

The early admissions season, which stretches from mid-October to mid-February and includes two rounds of binding Early Decision and one round of non-binding Early Action, is shaping up to be one for the record books. Although more top private universities are choosing the path of less transparency regarding their EA or ED application results, we’ve dug into publicly available data to see what they portend for students in the Regular Decision pool this year as well as for current juniors who are looking ahead to their early application process.

Application Boot Camp®
Need strategic guidance from start to finish? Try Application Boot Camp®.
Here’s what we know so far and our predictions for what these trends likely indicate:
EARLY APPLICATION INSIGHTS AND PREDICTIONS
This season saw increased application volume at private universities that still maintain test-optional admissions policies. As anticipated, testing requirements led to a decrease in early applications submitted at highly selective schools.
Among schools posting robust early numbers, we note:
- Over 9,500 students applied to UPenn through the Early Decision — roughly a 12% increase from last year’s total of over 8,500 applications. The combination of a major expansion to Penn’s financial aid (raising the income threshold for full-tuition scholarships from $140,000 to $200,000 for families with typical assets) and a continuation of its test-optional admissions policy no doubt fueled their increase.
- The University of Notre Dame saw its applicants for Restrictive Early Action surge by 16 percent to a record 12,917 REA applications for the Class of 2029. This is its first admission cycle since announcing a major new financial aid commitment with includes a new no-loan policy for undergraduate students and an expansion of its need-blind policy.
- Duke University, which remains test-optional, received 6,627 Early Decision applications, a 6% increase over last year (which saw a 30% increase in applications) and the highest in Duke history. Growth in the size of Duke’s ED pool was turbocharged last year with the announcement of full tuition grants for all undergraduates from North and South Carolina.
- Demand at UT Austin soared as applications for freshman admission increased 24% for the Class of 2029 as compared with the number of applications received one year ago. Everything is typically “bigger and better” in Texas, but a key driver of this increase are out-of-state applicants (up 40% over last year) who can now easily apply to UT Austin via the Common Application.
- More and more students are taking advantage of non-binding Early Action (EA) at public universities like UT Austin, U Georgia (overall EA volume up 13%), and UVA (ED applications are up 11% over last year).
On the flip side, other top universities saw drops in early application volume:
- Brown saw its applications drop by 19% to 5,048 applications. This is the fewest number of ED applicants to Brown since test-optional admissions went into effect for the Class of 2024. Interestingly, despite the overall drop in ED application numbers, Brown experienced a 22% increase in applications from international students, the result of its newly-instated need-blind admissions process for international students.
- Columbia, although still test-optional, experienced a slight drop (2%) in early admissions applications, likely the result of campus turmoil in the last year.
- After re-introducing its testing requirements three years ago, MIT initially saw a nearly 20% decrease in early application volume for the Class of 2027. After a slight rebound in volume last year, EA applications to MIT declined 4% this year.
- Yale University, in its first year of reinstating standardized testing, saw its early action applications to the Class of 2029 decrease by 14% over last year. Like their colleagues at Brown, Yale staff anticipated a decrease in application volume this early action cycle.
EARLY APPLICATION MACRO-TRENDS
The recent data released by the Common Application on applications submitted by November 1 provide interesting insights into this year’s application cycle. Some of the points we found most compelling (and our takeaways) include:
- 904,860 students submitted 4 million applications by November 1.
- On average, 4.43 applications were submitted per student.
- Hedging their bets, students are making more use of the EA option.
- Applications to public members (12%) grew more than those to private members (8%) over the last year.
- As we can see from early data reported, UT Austin and U Georgia are two clear examples of this trend.
- Applicants reporting test scores by this point in the season outpaces those not reporting for the first time since 2021.
- Despite only a small number of top colleges requiring testing, many students are clearly reporting their scores at test-optional schools.
- Domestic growth in applicants was fastest in the Southwest region. West Virginia (33%) and Texas (32%) were the fastest growing states since 2023–24.
- Now that UT Austin is on the Common App, this makes sense.
- The pool of students submitting Common Applications continues to diversify, with continued growth in the numbers of underrepresented minority (URM) students, first-generation college students, and those qualifying for fee waivers. URM applicants grew by 16%; the number of applicants who are first in their families to go to college grew by 19%.
- Socioeconomic diversity, especially in the wake of the Supreme Court’s 2023 decision on affirmative action, is a clear recruitment focus for top colleges.
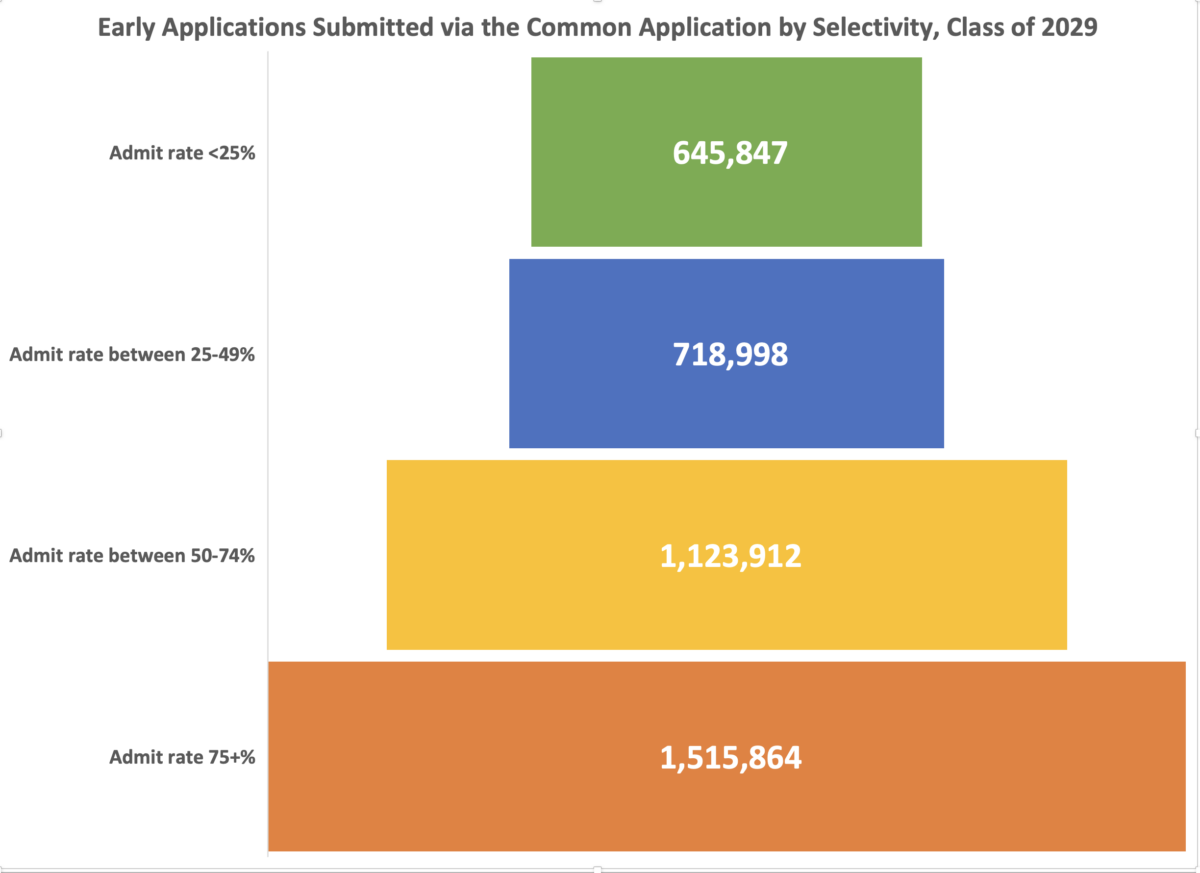
- And finally, out of a total of roughly 4 million early applications submitted, approximately 645,000 (16%) were submitted to the most selective colleges (per the Common App, those are schools with admit rates below 25%).
- Last year, about 13% of early applications were submitted to the most selective schools. As we see in the early results for the Class of 2029, schools who continue their test-optional policies are driving this growth.
READING THE TEA LEAVES: CLASS OF 2029 EARLY APPLICATION TRENDS
So, what does all this tell us? The Common Application continues to grow its presence by adding new member colleges. With more public universities now on the Common Application, it makes sense that the applications to public and less-selective colleges and universities will grow at faster rates and that the pool of students using the Common Application is becoming more diverse each year.
While the Common Application data helps us understand some macro trends, it’s also interesting to look at specific data from top schools for the past three early application cycles to see how application volume has changed.
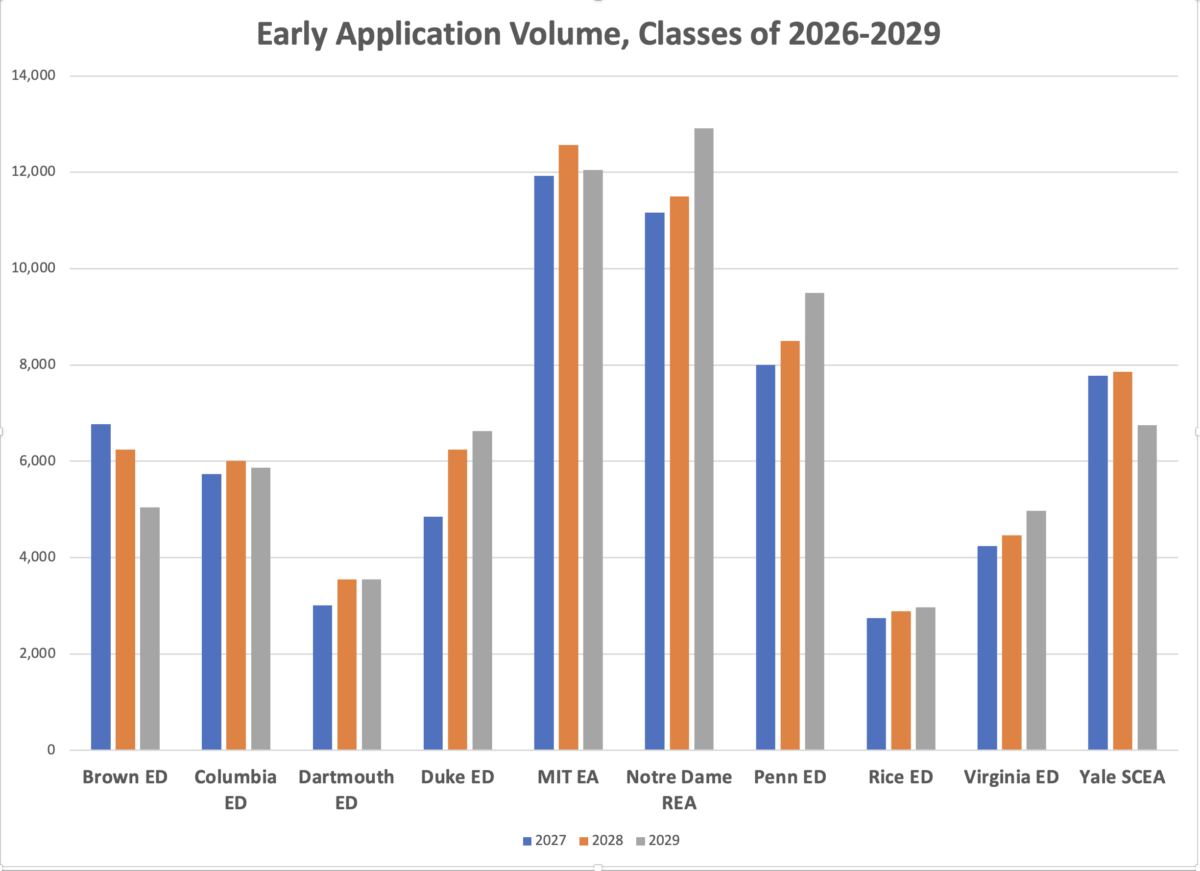
Early application volume for the Class of 2029 was a mixed bag – up for those top schools who maintain a test-optional admissions policy and down quite a bit at key schools who reinstated testing (Yale and Brown, especially). We’ll be watching for similar dynamics to play out in the regular decision pools but keep in mind that as the Common App’s own data tell us, increasing numbers of applicants are choosing to submit their scores, even to schools that are test-optional.
As more data on early applications for the Class of 2029 becomes available, we’ll update our charts and add our expert analysis.
If you enjoyed this post, follow us on Instagram @toptieradmissions for more tips and subscribe to our blog for expert insights & college admissions news!

In addition, Maria is proud of her long-term volunteer work with Opera North (Lebanon, NH) in fundraising, marketing and audience engagement. She is an avid masters rower with the Upper Valley Rowing Foundation (Hanover, NH) and also serves as a member of its board of directors.
- Should Your Student Apply Early Decision (and to Where)? - July 20, 2026
- 2026 College Acceptance Rates: What’s Behind the Record Lows and What Families Should Know - May 18, 2026
- Class of 2030 Early Application Trends: Reading the Tea Leaves - January 29, 2026
